devices

[ITP: Connected Devices] Device Data Dashboard IV

This is a continuation of my device data dashboard, see my previous blog post here.

Getting the Ball Rolling Again

I tried getting my sensor set up sending MQTT data at home and got my local webpage running and I got an error I hadn’t seen before running Tom’s mqtt.js example: “mqtt.js test.mosquitto.org failed: The certificate for this server is invalid”. I remembered that I wasn’t able to get my Arduino to connect to the broker with a “WiFiSSLClient” so I changed that to just “WiFiClient” in my Arduino sketch. I changed this in my script.js file to use the unencrypted port 8080:

I also needed to get reasonable RGB values from my sensor because the getRaw() function returned some 16-bit value read straight from the TCS34725’s registers. I looked through the Adafruit Arduino library and its getRGB() function returns the RGB values normalized to 0-255, exactly right for web colors.

Dashboard Construction

So I thought about it and the reason this dashboard is so important to me is because I find myself stuck indoors too much (almost all the time) and I could run this webpage in the background to check the color of the sky during the day. I placed my Arduino + sensor on a window sill in my apartment that gets direct sunlight during the day. Fingers crossed the roommates don’t mess with it!

I modified Tom’s code by removing the stuff that wasn’t necessary to my dashboard; at this point I do not need to publish to the broker. I am super rusty with web stuff so my first goal was to change the background of the webpage to match the RGB sensor value. Then I referenced the amazing Bianca Gan’s “Thesis Clock” code to see how she drew different shapes with JavaScript. I used the html canvas element to draw rectangles with the RGB values from my sensor.

Since this dashboard will be acting as a kind of clock, I want to track the changes in sunlight over the course of a day. We know that the MQTT broker doesn’t hold on to any data over time so it is up to the JavaScript client to hold on to relevant data. I created three arrays to hold on to past RGB values. I made the array 100 elements long because of the following rationale: check sensor every 15 mins * 24 hours a day = 96 data points —> make it a perfect square of 100. If the array fills up, the script replaces the oldest data point with the newest one. Thanks Tom!

Next I wrote the logic to draw the grid of squares and loop through the RGB data to assign the fill colors. I started small with a grid of 9. I also made a dummy array to test the fill of the grid. Looks like the logic is correct!

Here’s what the dashboard looks like working to scale and with the sensor data. The newest data reading is always in the top left and the oldest is the last rectangle. I did some minimal CSS to get the dashboard looking better. I also got a timestamp for the last data point using the Date() object in JavaScript.

The pink is when someone turns on the living room light in my apartment!

Sunny day

Cloudy day

For the time being, my code lives here if anyone is interested in peeking.

Going Live

  1. Put all web files into “public” folder

  2. Write the server.js and package.json files. I stole this server code from Bianca.

  3. ssh into digital ocean server in computer terminal.

  4. I already had my ITP repo cloned to my droplet, navigate into it and “sudo git pull [url]”.

  5. Follow this tutorial like we’ve done in the past to use PM2 to run the server and set up Nginx as a reverse proxy.

IT’S ALIVE! I’m amazing!

Questions

Why?

Why can’t I get my system working with SSL?

Using test.mosquitto, I had issues connecting to the broker on the web page side. I switched over to shiftr.io and I didn’t have those problems anymore. Why is that?!

Here’s a link to my next blog post about this project.

Resources

❤️ https://github.com/biancaagan/QuestionableThesisClock ❤️

https://github.com/tigoe/mqtt-examples/blob/main/browser-clients/mqttjs/MqttJsClientSimple/script.js

https://www.w3schools.com/graphics/canvas_drawing.asp

https://developer.mozilla.org/en-US/docs/Web/API/Canvas_API/Tutorial

https://www.w3schools.com/js/js_arrays.asp

https://stackoverflow.com/questions/33745249/js-how-do-i-create-a-10x10-grid-of-filled-rectangles

https://javascript.info/date

https://www.digitalocean.com/community/tutorials/how-to-set-up-a-node-js-application-for-production-on-ubuntu-20-04

[ITP: Connected Devices] Device Data Dashboard III

In my last blog post I got my sensor logging data using the TCP-to-net-cat connection. As a review, I’m going to get my sensor logging over a broker connection using MQTT, but I’ve done this before.

MQTT data logging

Recall that “Message Queueing Telemetry Transfer, or MQTT, is a lightweight IP-based messaging protocol designed for communication between sensors, controllers, and other devices. It’s designed to support equipment that may not always be online, like automated devices built with microcontrollers,” as Tom put it so well.

Using the ArduinoMqttClient library, start with Tom’s ArduinoMqttClient.ino. For some reason I was unable to connect to the broker with the “WiFiSSLClient” in line 33, but changing it to “WiFiClient” worked for me. I also setup the broker settings (test.mosquitto.org, port = 1883, topic and clientID). Next I added in all my sensor stuff (TCS34725). I got it working! I’m using MQTT Explorer and am subscribed to the “conndev/#” topic under the "Advanced” settings; looks like I’m the only one here right now.

Side quest: Turning an LED on/off with MQTT

Drumrooooollllll… I’ve been dying to learn how to do this for some personal projects of mine so I’m excited we went over this example in class. I’ve modified the MqttClientSubTopics example to just manipulate the LED. I removed the sensor stuff and added control of the built in LED on my Arduino. Here’s a video of me updating variables using the MQTT Explorer software.

Web Dashboard

Ok, back to the Arduino example with sensor data. Now that my TCS34725 sensor is successfully sending the sensors RGB values to the MQTT broker, I shifted my focus to Tom’s MqttJsClientSimple example. I think I was able to get this to work?! I change the topic to “conndev/makin-stuff” and occasionally the RGB values flashed on the web page. I think they’re only showing up in the instant that they’re published?

Looks like the RGB values are 16-bit, so I remapped them to the range 0-255 for web colors. I don’t know how to internet!

If you’re following along in this project, see my next blog post here.

Resources

https://tigoe.github.io/mqtt-examples/

https://vimeo.com/375315679

[ITP: Connected Devices] Device Data Dashboard Part II

Setup Sensor

So to start where I left off last week, I need to use an actual sensor. To get myself started, I pulled out the TCS34725 RGB sensor I used in Understanding Networks last semester. It communicates over I2C, so I connected the sensor to my Arduino Nano as follows:

Arduino Nano 33 IoT

  • 5V

  • GND

  • SDA

  • SCL

TCS34725

  • VIN

  • GND

  • SDA

  • SCL

Once the sensor was connected correctly I ran the “tcs34725.ino” example from Adafruit’s library to double-check my circuit. Looks like it works! Also, I noticed as I was getting this sensor setup that this product has been discontinued by Adafruit, so I might consider using a different sensor for this or future projects.

Integrate with TCP Client Example

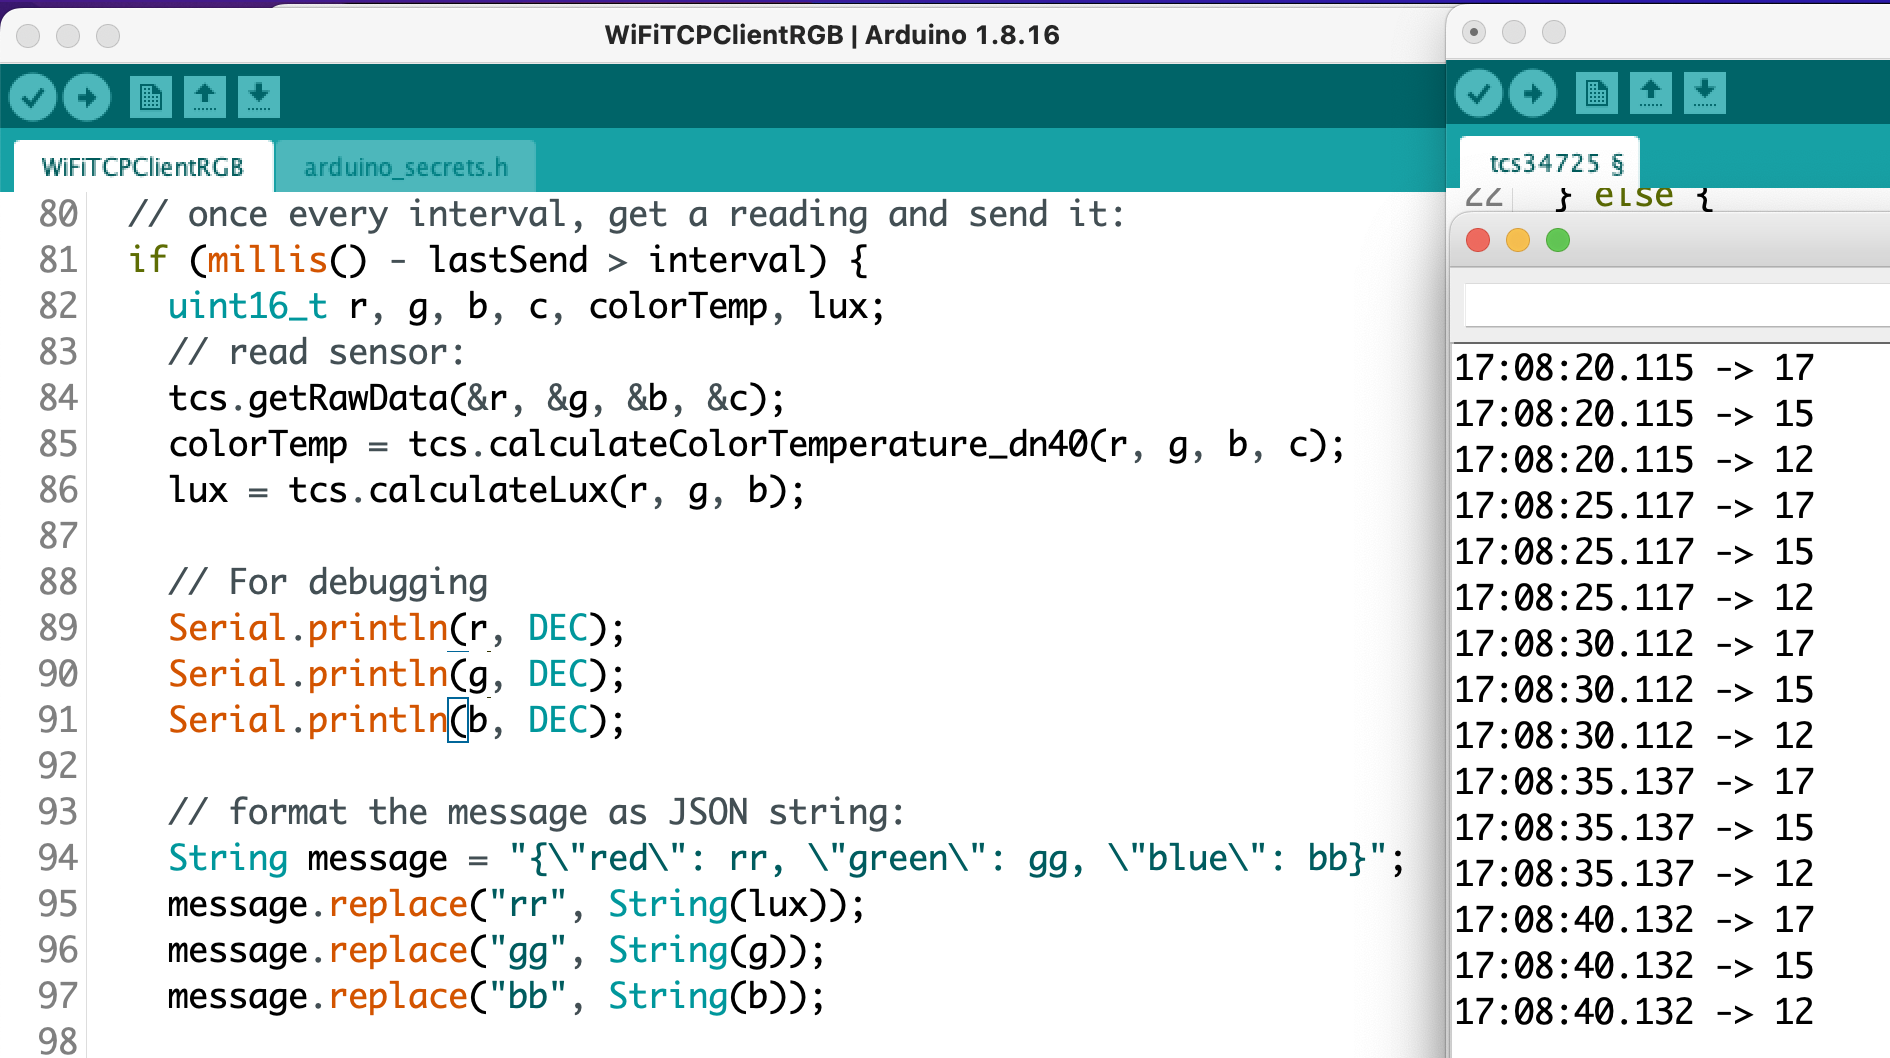
Port the “tcs34725.ino” example to Tom’s “WiFiTCPClientLogger.ino” example from last week. I was able to get my sensor readings to send over the sandbox370 network and they were received by netcat application listening on port 8080. But what is super weird is that the RGB readings are totally wrong, like nowhere close to the data I saw running the library example. At first I thought the issue may be caused by concatenating the message or the replace() function but below is my debugging, and even the raw data from the library is wonky. I’ll have to come back to this tomorrow.

Ok, I looked at this the day after running into this bug and turns out if you want the sensor output to look the same between different sketches you need to remember to initialize it with the same parameters (🤦‍♀️). This output looks a lot better!

Get sensor data onto web page

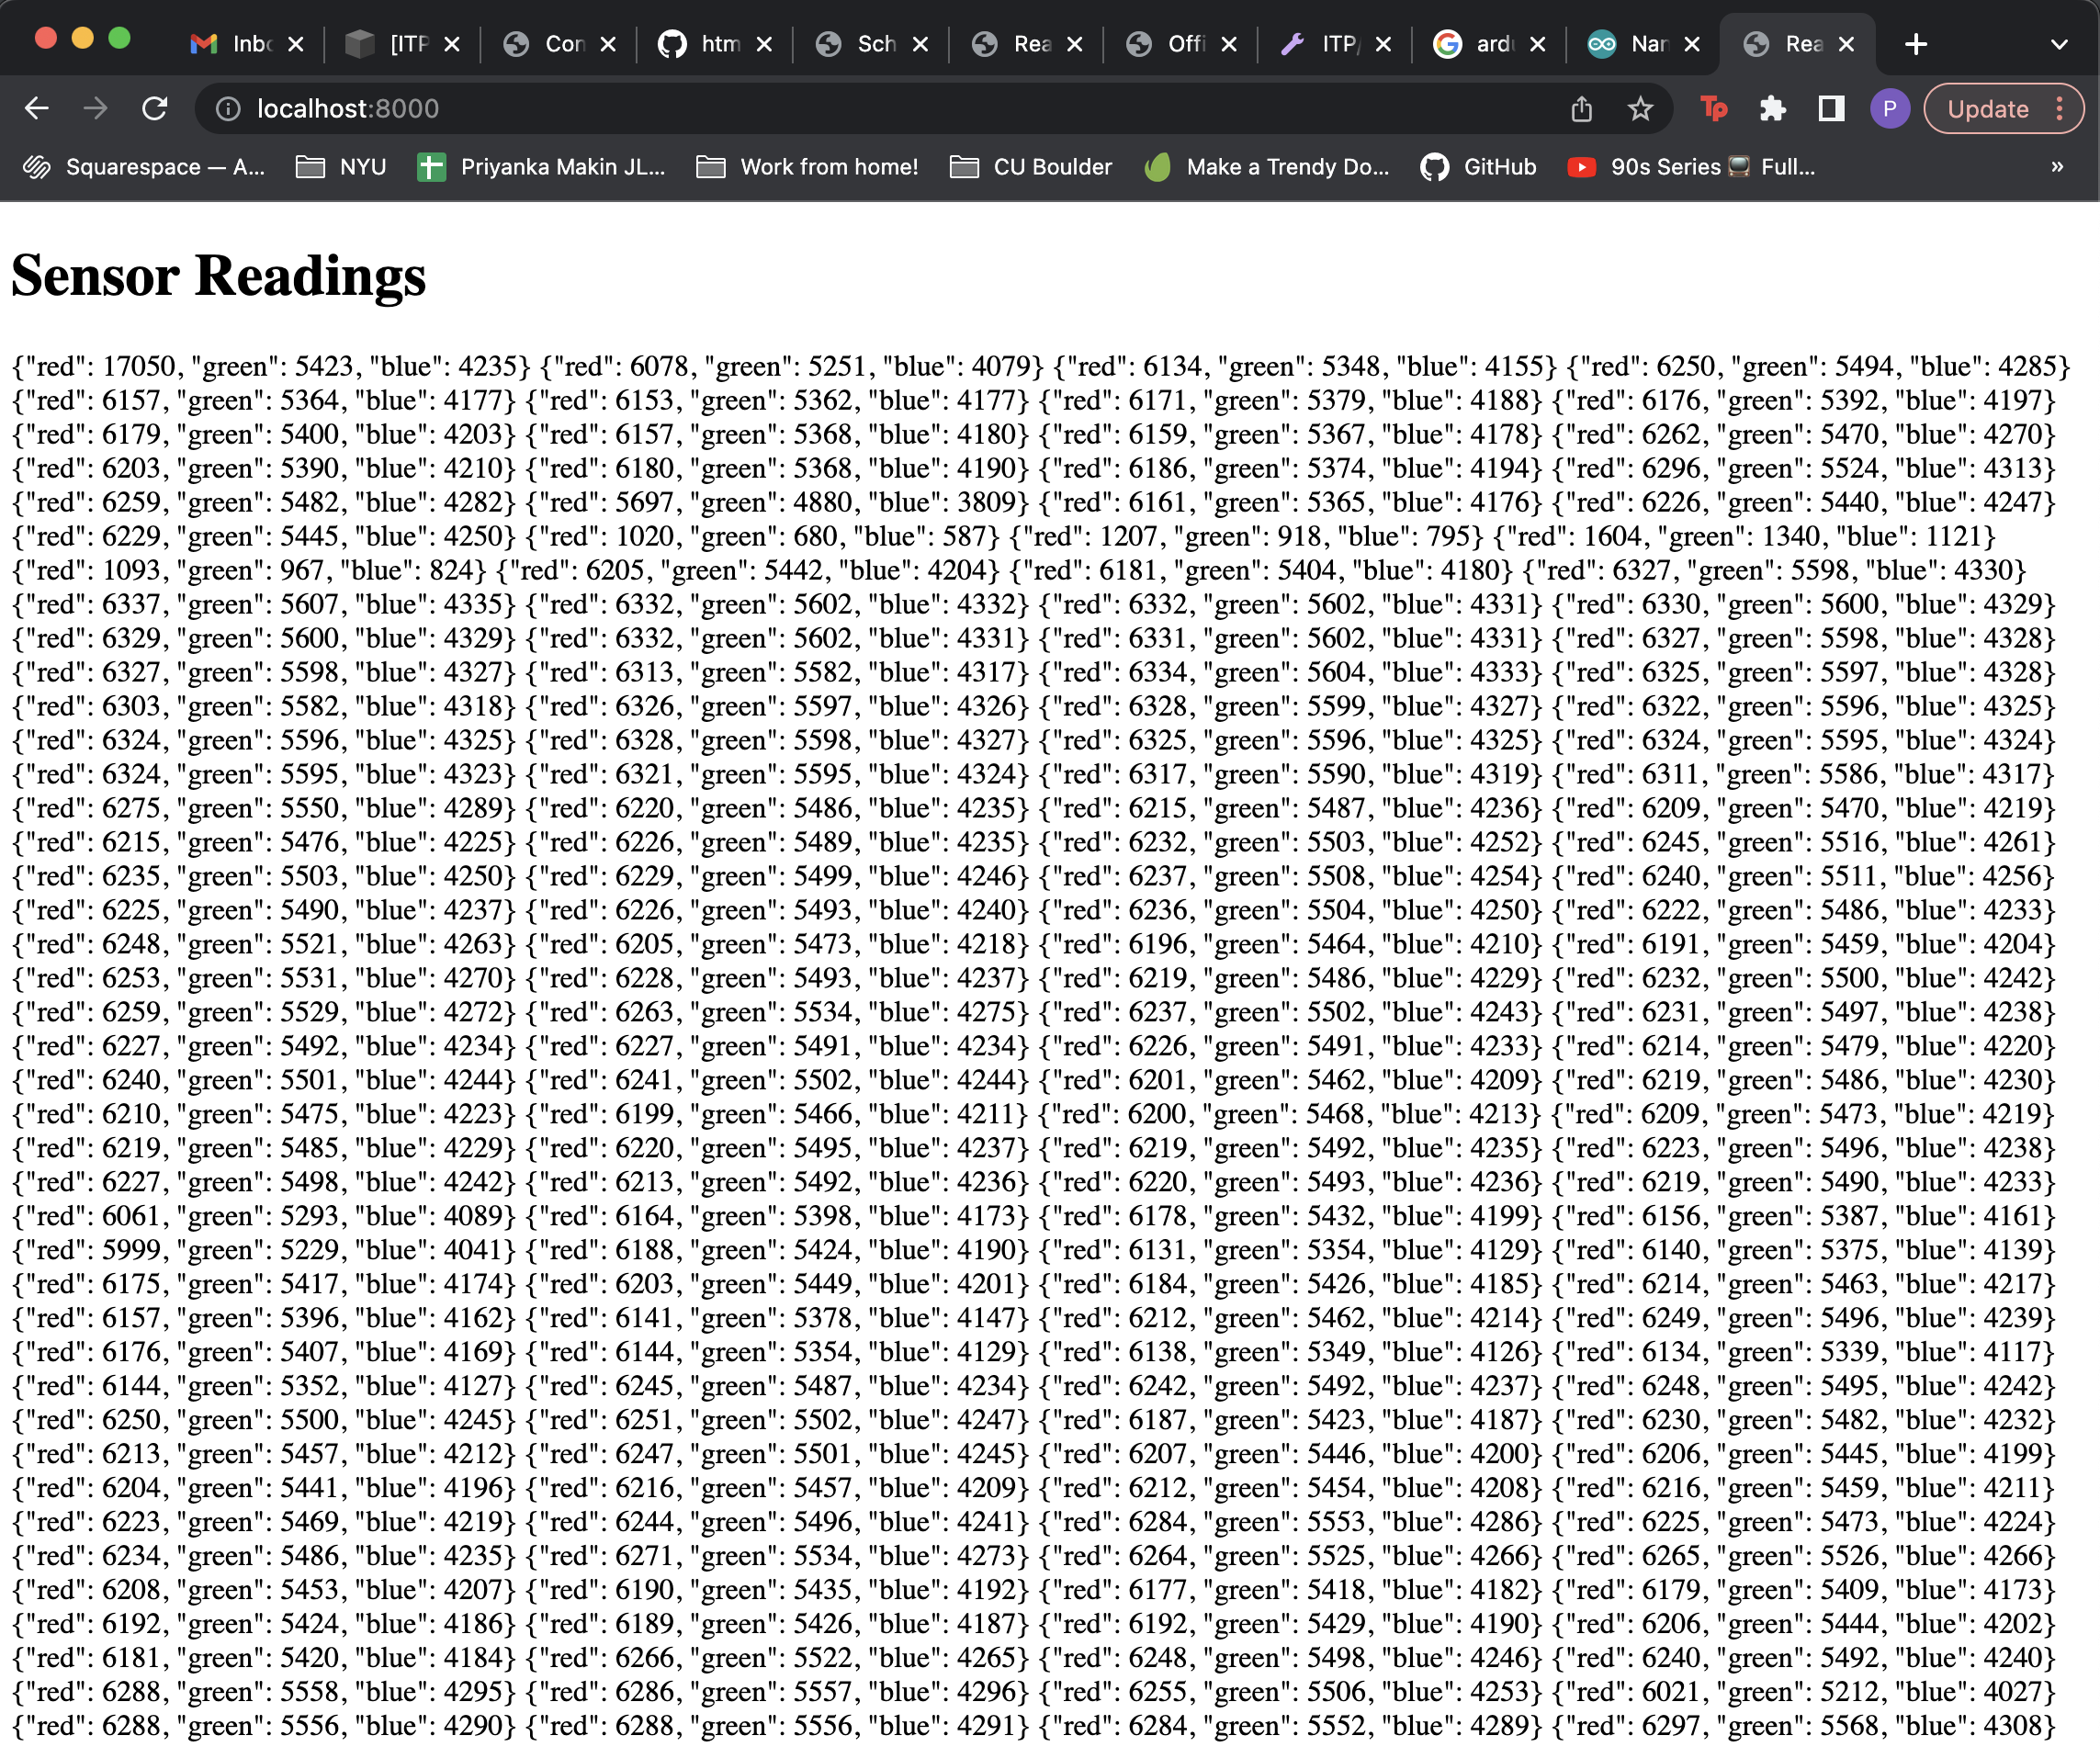
Now I needed to save my sensor data to a .json file. I followed the tutorial and ran “nc -l 8080 | tee log.json” in my terminal window. I could see something was happening because using the “tee” command I could see the sensor data on the terminal itself. But where is my log.json file? I looked at a couple of other people’s blog posts and found that my file is here:

Which totally makes sense because in the terminal we are working in my user’s root directory. I followed the tutorial’s directions to run the sketch, navigate to the sketch directory (with index.html, script.js) and using Fetch to read the file. Typing “nc -l 8080 >> log.json & python3 -m http.server” in the terminal starts the server and then you can see the data coming in!

For a continuation of this project, please see my next blog post.

Resources

https://tigoe.github.io/html-for-conndev/DeviceDataDashboard/

[ITP: Connected Devices] Device Data Dashboard, TCP Socket

Process

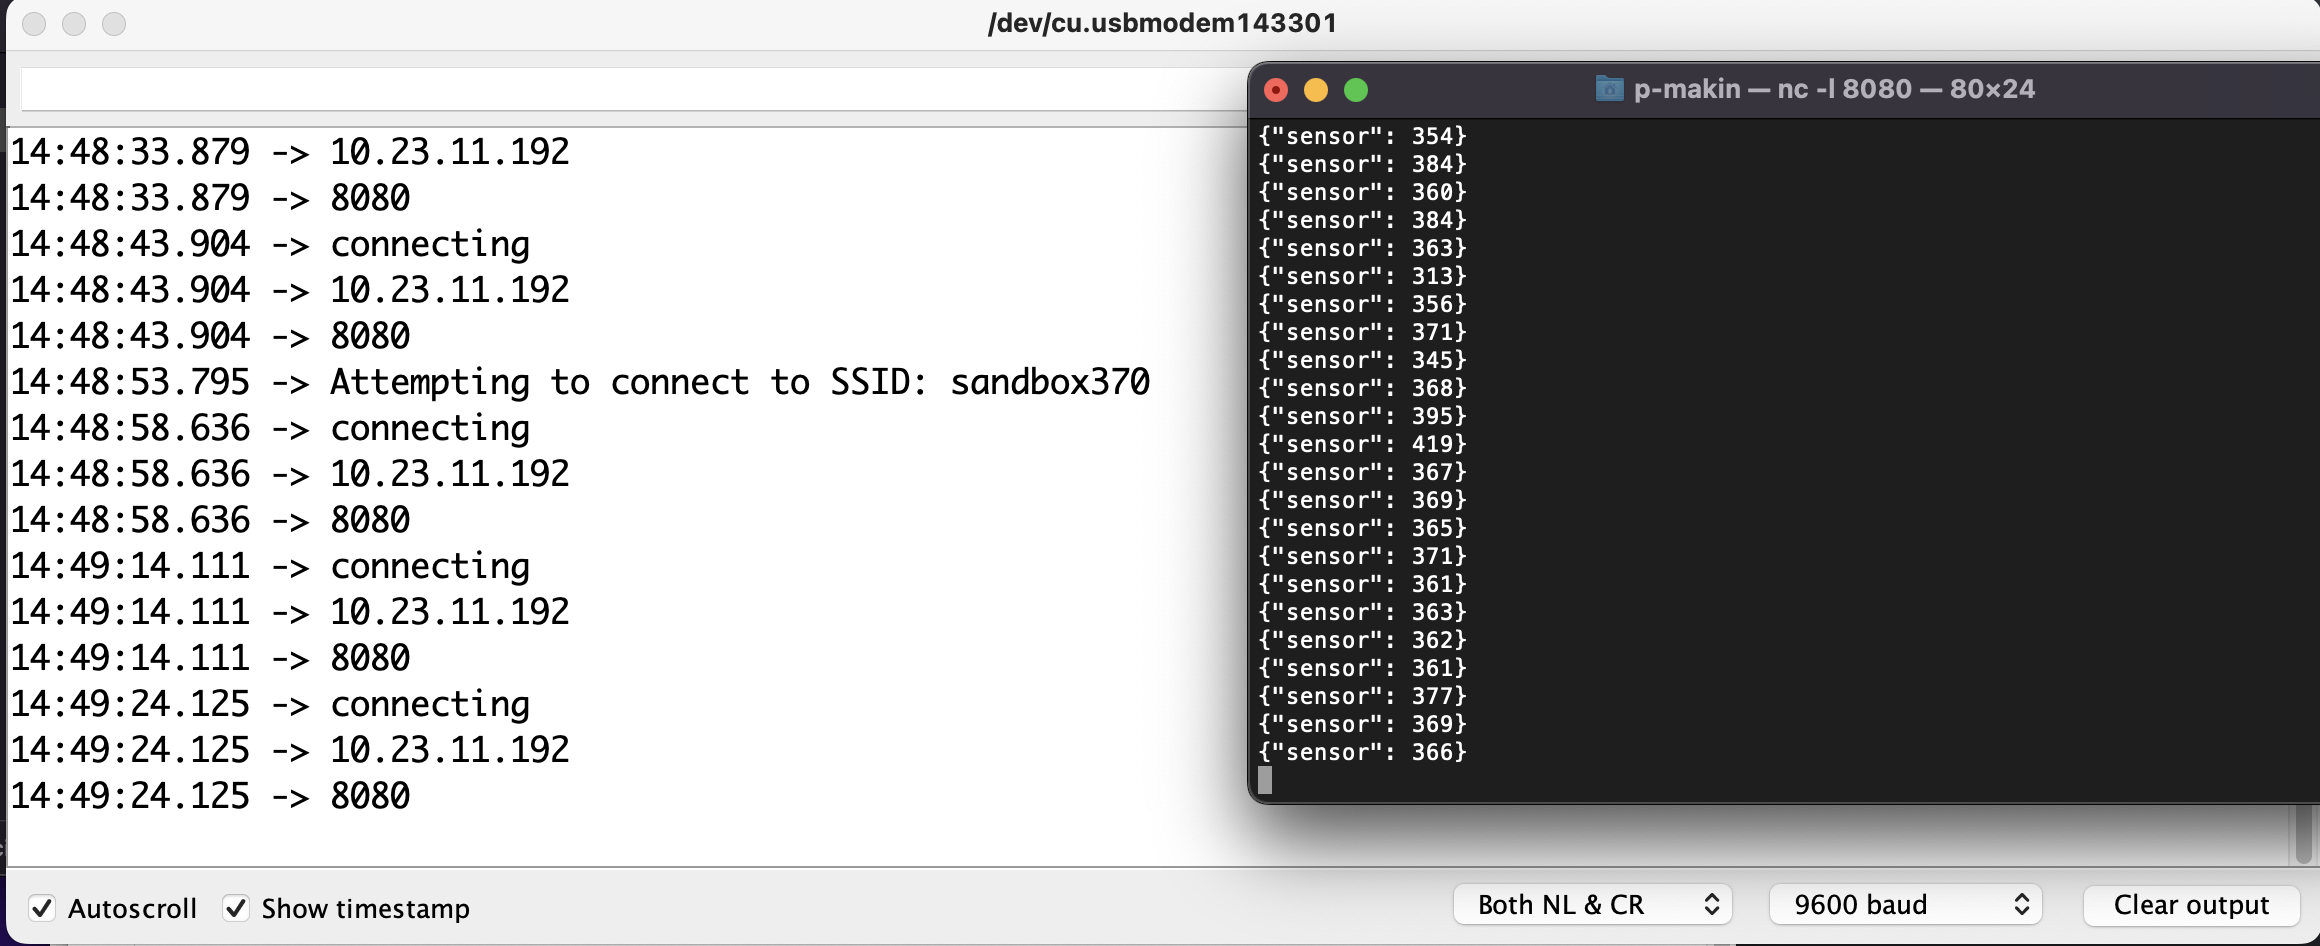
I did a bit of work to get kinda started on the device data dashboard assignment. My goal was to create a TCP socket connection between my Arduino Nano 33 IoT NINA module and my computer’s terminal. I first started with Tom’s WiFiTCPClientLogger example. Making sure my computer was on NYU’s experimental network, sandbox370, I updated the sketch with my computer’s IP address. I also added the “arduino_secrets.h” file with the network credentials to the example’s directory. Then, in my terminal I typed “nc -l 8080” and I could see my “sensor” readings coming over port 8080. Success!

Next Steps

The next thing to do would obviously be to connect my Arduino to an actual sensor so that I can track some real data. I’ve got a TCS34725 RGB sensor that I used last semester that I could work with. I’ve also got a weird spy camera from Adafruit, I wonder if I can create any interesting projects with that.

After getting some real sensor data, I think I need to port it to a .json file and create a webpage to display my information. Yay HTML, CSS, JavaScript, DOM!

Also, this is just a note for my future self but I really want to learn how to use MQTT communication to update variables in a sketch running on a microcontroller hands-free. Would I need 2 Arduino Nano’s for that?!

Resources

https://tigoe.github.io/html-for-conndev/DeviceDataDashboard/